Application Insights for Kentico
Introduction
At the recent Build 2016 conference Microsoft really wowed developers with all sorts of new bells and whistles for Visual Studio, Azure, Bots, and Windows 10. Included in some of the new enhancements for ASP.Net and Visual Studio was a pretty cool new feature called Visual Studio Application Insights. According to Microsoft, Application Insights allow developers to detect issues, solve problems and continuously improve their applications. The technology is intended to help quickly diagnose any problems in a live application.
Since my team and I are in charge of monitoring quite a few web applications, I found the topic of Application Insights particularly interesting as it relates to Kentico based applications. I immediately thought of questions like would this technology work for web applications only hosted in Azure, or would it also work for existing applications that were on-premise. I was also curious if how easy it was to install and use the technology, how much overhead that it introduces, and exactly how the heck does it actually work.
Keep reading to find out how easy it is to add Visual Studio Application Insights to a Kentico based web application and what value, if any, this technology can add to your every day job as a web developer or architect.
The Promise
Application Insights is a new technology that is powered by the Microsoft Azure cloud. It promises to provide developers and IT professionals full insight into just how well an application is performing. It's actually a fairly large promise because the documentatation states the tool will work for iOS, Android, and Windows apps, J2EE and ASP.NET web applications, and WCF services (hosted in Azure or On-Prem). There's also a complimentary Javascript SDK that is promised to work on any web page. That's a pretty wide set of today's apps and sites out there in the wild. You gotta love Microsoft's marketing machine right?
The technology also has many facets to it. In the various nuget packages and SDKs the following functionality is included:
- .Net Performance monitoring via usage analytics (think server resources like http response time)
- Status monitor to diagnose IIS issues on live running web sites (without re-deploying)
- Usage analytics for pages of the website (think client side like Google Analytics)
- Automated stress testing
- System availability and health monitoring (think uptime / downtime tracking)
- Crash reporting for apps and devices
As you can see it's a pretty large promise. The best part, right now there is a free tier that comes with 5 million data points and 7 day's worth of data retention which seems adequate enough for most sites. From there the plans go up to about $25 per month, $99 per month, and then the of course "call for pricing" tier, which is pretty much unlimited tracking.
The Setup / Requirements
The best way to start is to read the excellent getting started guide for Application Insights that Microsoft provides. You will of course need an Azure account to do this. Microsoft will do anything to drive cloud consumption right? But as the guide says, there is one main requirement as far as your tooling goes. You will need to update your Visual Studio 2015 ide to Visual Studio 2015 Update 2. By the way this takes more than just a few minutes, and it does require a full reboot of your machine.
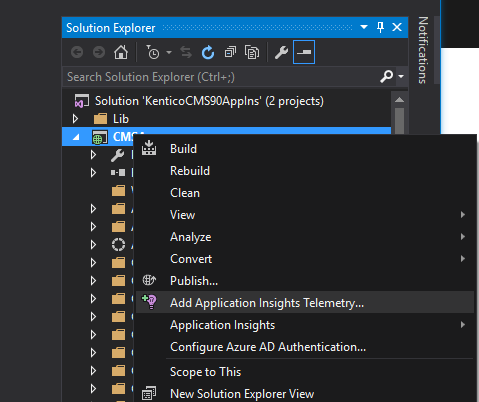
Once you have that, there are really two ways to start adding Application Insights to your project. If you have an existing application you can right click your project in your Visual Studio solution, and then click the Add Application Insights Telemetry context menu item in solution explorer. Or if you are creating a brand new project, you can check the Add Application Insights to your project checkbox to the right of the Create New Project dialog. Since this post is about adding Application Insights to a Kentico site, we are going with the first option of adding it to an existing project.
Again I am assuming you know and have already installed Kentico 9.0 for this walkthrough. As you can see in the screen shot below, I am adding Application Insights to the CMSApp project in the default Kentico solution.
When you do this, the following prompt appears. Here is where your Azure account comes in. You of course need to have an active subscription and the correct credentials to do this. But really, this is where you select the resource pool (or target) that you want the telemetry for your app to send the data to.
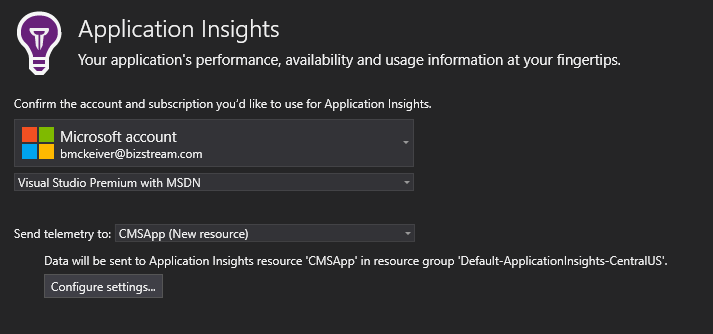
After you click the Add button on the dialog, another progress window appears and behind the scenes Visual Studio is actually running a nuget command to download the appropriate package, add the right references to the project, and configure the all-important ApplicationInsights.config file. For me, on my home workstation, this took about 3 or 4 minutes to finish. I think it took a while because it scans the entire Kentico solution. We all know there are just a few files in a Kentico installation.
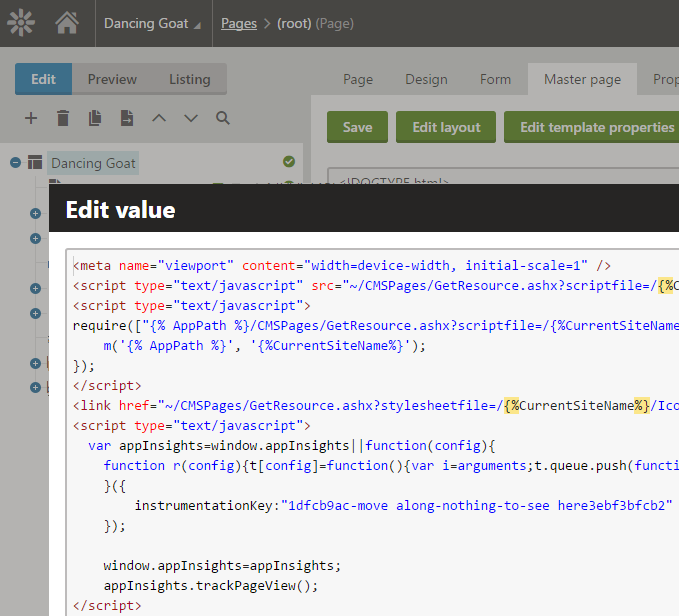
To get the full set of measurements (both server side and client side) you also need to inject a set of Javascript into all of your pages. This is easily done in the inside of the Kentico admin interface. You can edit the head tag via the Master Page Template (if you are using the Kentico portal engine), or if you are one of those MVC developers you can simply add it to your _Layout.cshtml file. You are actually given the correct Javascript file from the Azure Portal -> AI -> Getting Started -> Client Side Telemetry blade. It should have your account's correct instrumentationKey in the script already for you to copy and paste it in.
The Results
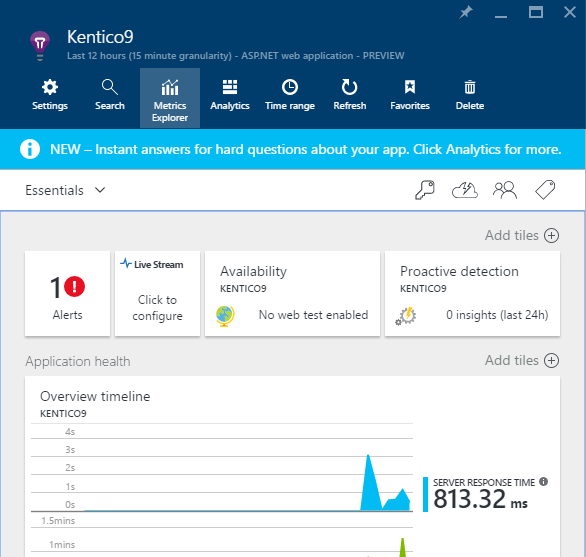
Those steps are really all it took to add Applications Insights to Kentico. Now as soon as I started running the Kentico site on my localhost, it all just started working. And frankly I could not really see a difference in the performance. With about a short 5 minute delay the Azure portal started reporting results.
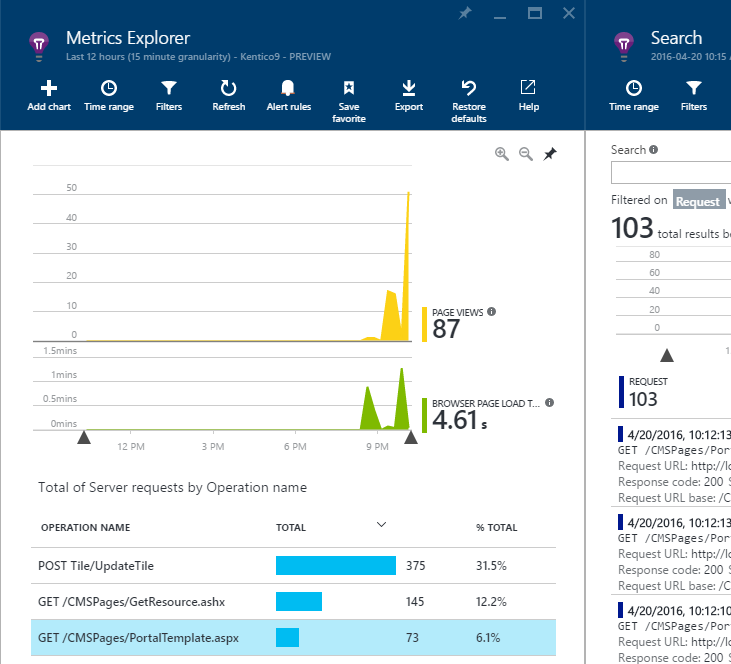
It really is impressive on all of the data that you get. Each item is a click through to another layer of information and metrics that you can slice and dice however you wish.
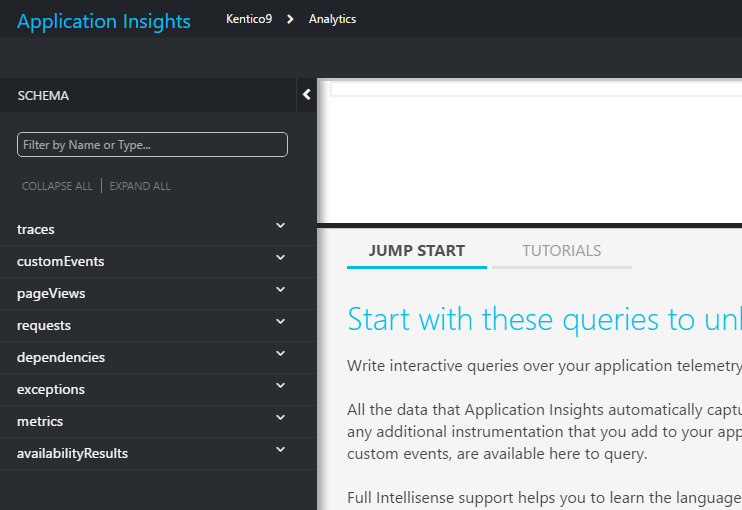
There is also an even more power Analytics preview app that you can almost write natural language queries to see things like "What are the top 10 exceptions impacting most % of users in the last 3 days?"
Click the image above to see the full picture where it shows more examples.
Logging Kentico Errors to Application Insights Telemetry
Now since we have the insights hooked up, I thought it made a ton of sense to start pushing errors and exceptions to the Azure Portal. I used the Kentico API to look at the Kentico event log errors (not warning, nor information event types) and simply added the exceptions to the telemetry using the TelemetryClient object of the Microsoft.ApplicationInsights library. To do that required a very simple set of code that I have posted below. Because of the fact the SDK already has a nice set of C# methods available to use because it is not included in the Kentico project.
using System.Collections.Generic;
using Microsoft.ApplicationInsights;
using CMS.Base;
using CMS.DataEngine;
using CMS.EventLog;
/// Partial class that allows you to register custom handler methods and classes.
/// Adds the CustomEventLogHandler attribute.
///
public partial class CMSModuleLoader
{
{
/// Microsfor Applicaiton Insights client for Azure Portal
private TelemetryClient telemetry = new TelemetryClient();
/// Called automatically when the application starts, hooks into the base Kentico event log
///
public override void Init()
{
EventLogInfo.TYPEINFO.Events.Insert.After += EventLog_Insert_After;
}
///
/// Custom event handler for after Event Log Item insert, only logs exceptions to AI not warnings or informations
///
/// Kentico subsystem
/// the event itself of type EventLogInfo
private void EventLog_Insert_After(object sender, ObjectEventArgs e)
{
EventLogInfo theEvent = e.Object as EventLogInfo;
if(theEvent != null)
{
if(theEvent.EventType == EventType.ERROR)
{
// Set up some properties, you could add more if you want, user makes the most sense to me
var properties = new Dictionary<string, string>
{{"Users", theEvent.UserName}};
telemetry.TrackException(theEvent.Exception, properties);
}
}
}
}
}
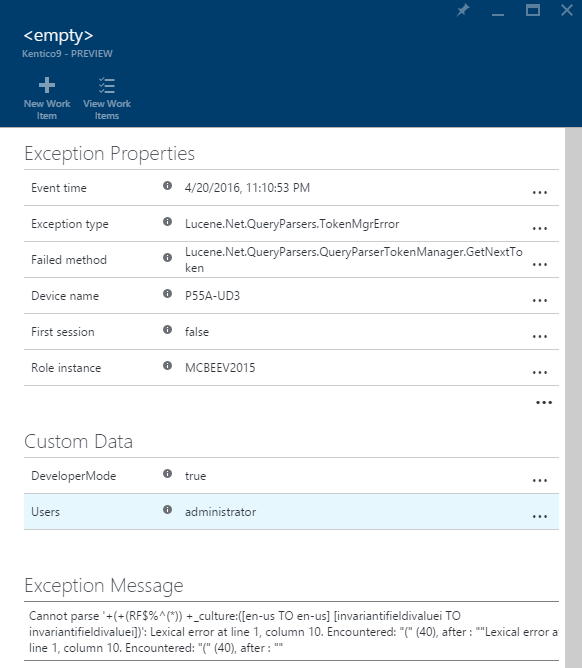
The result is that now exceptions not only show up in the Kentico event log, they also are being aggregated up to the Azure Portal. The blade below shows how my custom property of the UserName of who caused the error shows up in Azure too in the Custom Data section of the Exception Properties.
For the astute of you, the quickest way to cause an error in a Kentico site is to throw something in the Smart Search input box that Lucene cannot handle. Hint it's a garbage string of text that includes a plus sign character. Luckily the front end of the page does not show the error to the users, but this will generate an error in the event log every time.
This opens up some really awesome possibilities to debug and troubleshoot live errors as they occur. Or you could start grouping and sorting the data for the most common exceptions in the last X days of actual usage. I thought this was pretty cool.
Conclusion
I am just scratching the surface of what you can do with Visual Studio Application Insights in your ASP.Net applications. There is a ton more you can do with setting up Alerts on metrics like high CPU usage over a period of X minutes, or setting up performance tests to automatically hit your site from different regions of the cloud to put it through some stress tests, to doing simple availability checking. My guess is that we are going to see this in play more and more as it goes from a "preview" state to full on RTM.
I think I have proved the technology does play nice with Kentico. One serious word of caution though. I consider this a prototype and don't condone running it fully in a production site. Especially if that is a mission critical or full e-commerce site. Proper testing should be done and approval from Microsoft moving Application Insights out of the "preview" state should happen first. However, if I have the time, I am seriously considering adding it this humble blog here at Mcbeev.com. If I do that, I will definitely make an update to this blog post with the results.


